tillamook county creamery
association is a certified b corp
© 2023 Tillamook. All rights reserved. Privacy Terms of Use CA Supply Chain Act
*All farmers who supply milk for Tillamook products pledge to not use artificial growth hormones. The FDA has stated that no significant difference has been shown between milk derived from rBST treated and non-rBST treated cows.
STEWARDSHIP
AT THE SOURCE
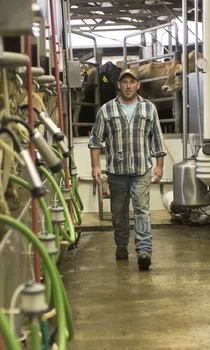
Stewardship starts where we live and work. We take seriously our responsibility to the people, animals and environment surrounding us, and we are taking action to show it. The investments we make locally in our farms, our truck fleet and our facilities have impacts that stretch well beyond our hometown locations. Alongside other initiatives across the dairy industry, these efforts add up to big changes on a global scale.
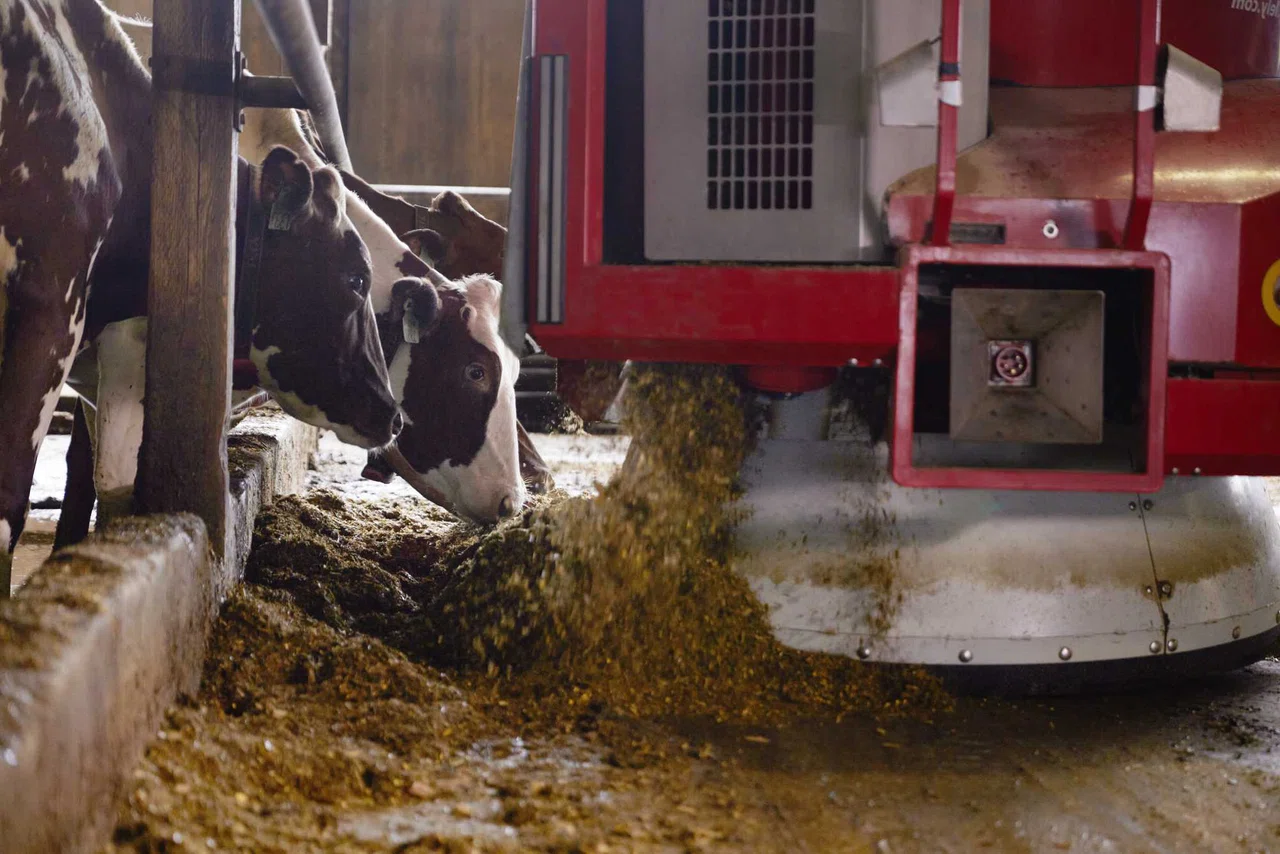
Our Climate Action Plan
As a certified B Corporation,™ we have made a public commitment to reduce our impact on the planet—which is why we created a detailed Climate Action Plan in 2022.
Climate change is a threat to farming, our business and the world. That’s why we’re taking action on farms, in facilities and in our fleet to meet the following goals:
CLIMATE ACTION PLAN

30% reduction in Scopes 1, 2
and 3 GHG emissions by 2030

Achieve GHG
neutrality by 2050
Our roadmap of strategies and a mindset of continuous improvement will help protect and preserve our planet now and for future generations. Read on for some highlights from the past year.
our climate action plan
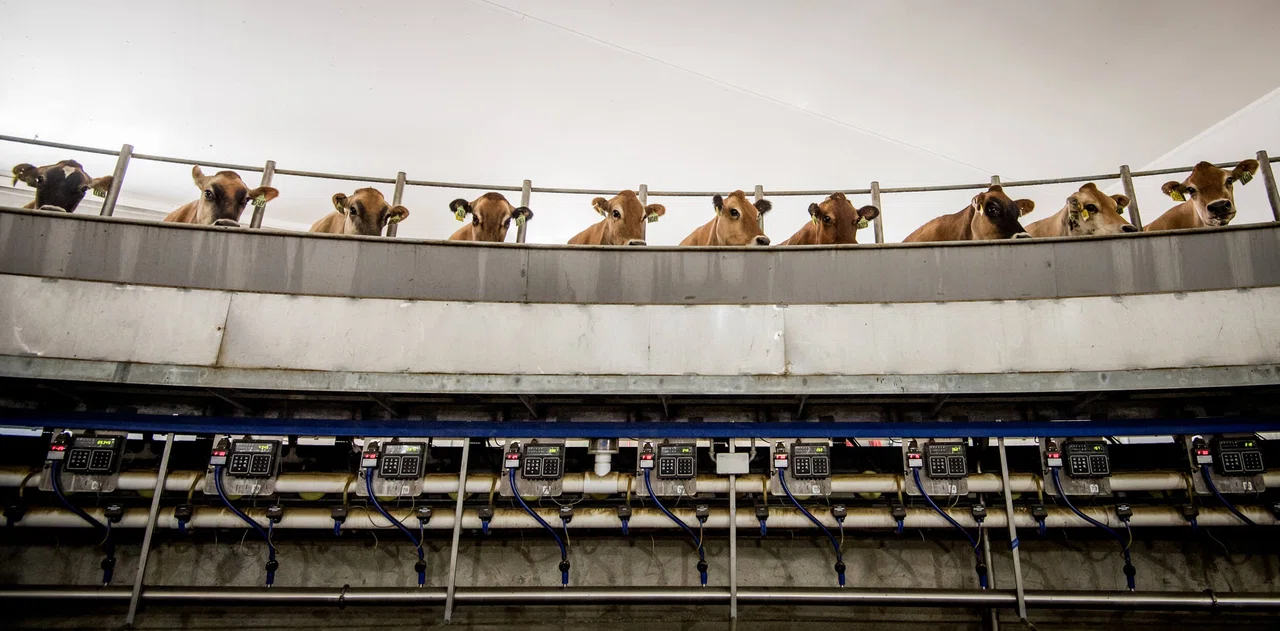
FARMING WITH THE FUTURE IN MIND
To reach GHG neutrality by 2050, we first need to understand farm-specific practices and associated emissions so that we can track progress over time. Since 2020, participating farms within our cooperative have taken a voluntary survey to measure their specific GHG footprint. This survey, managed through FARM ES (Farmers Assuring Responsible Management – Environmental Stewardship Program), asks about the entire lifecycle of dairy production — including the number of cows, amount of electricity and fuel consumption, as well as feed production and manure management practices — to determine a farm’s footprint.
By increasing the quality and accuracy of our GHG measurement, we can track progress toward our climate goals and work with our farmers to implement strategies that will reduce emissions in our supply chain.
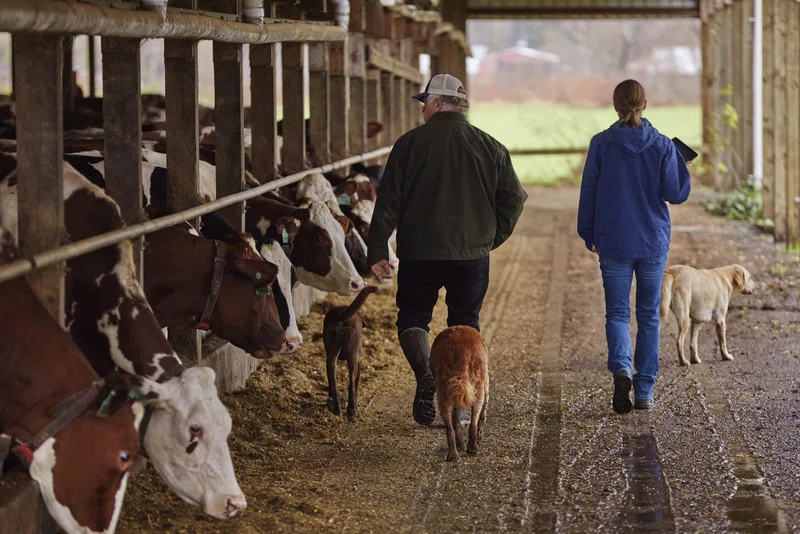
34% OF MEMBER FARMS
of TCCA have measured their farm-specific GHG footprint so far.
53 MT/ACRE*
is the average carbon in the soil among participating member farms, which is some of the highest carbon storage among all land use across the U.S. and Mexico.1,2
*Metric tons per acre.
Establishing a soil carbon baseline
Establishing a soil carbon baseline
There’s plenty of talk about carbon emissions in our industry, but did you know that farmland is also storing carbon? The unique climate of Tillamook County, combined with the climate-smart practices our farmer-owners are implementing on their farms, means that our fields store immense amounts of carbon in their soil. In 2022, 50% of our member farms opted in to a benchmarking program to measure just how much carbon our farmland stores. Using soil sampling tools refurbished by the welding class at Tillamook High School, we contracted an expert soil sampling company to more accurately measure our total carbon storage.
CASEY STOREY
Natural Resources Manager,
Field Services, TCCA
By sampling our soil for carbon and other components, we can see how a century of dairy farming maintains very high levels of carbon in the soil. As we look to the future, it’s also giving us a baseline that we can bring back to the farmers so they can see where they stand against their peers in the region and the nation.
THE GOAL ZERO TEAM GETS DOWN TO BUSINESS
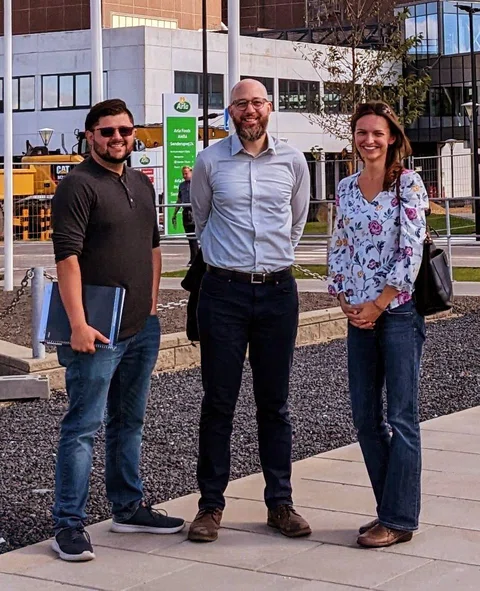
Meet the new team working to reduce our environmental impact at TCCA: the Goal Zero Team. This cross-functional team includes members from our Stewardship, Engineering and Operations departments, who are tasked with reducing energy, water and material waste at TCCA facilities. Founded in 2021, the team works on embedding footprint reduction activities into everyday operations by prioritizing high-impact projects and expanding participation in improving efficiency efforts.
By working with teams and leaders across our facilities, the Goal Zero Team helps us understand energy, water and waste impacts before undertaking a project. By estimating impacts in advance, we can better allocate resources in an effort to evolve our facilities with bigger goals in mind rather than tackling individual projects in a piecemeal fashion.
Check out some of the initiatives they’ve helped spearhead in the past year on the following page, and click below to learn more about our commitment to Enduring Ecosystems.
ENDURING ECOSYSTEMS
Upcycling Cheese Waste in Boardman
Upcycling Cheese Waste in Boardman
In our mission to deliver only the highest quality products possible, food loss is inevitable. But just because a block of cheese doesn’t meet our exacting standards, that doesn’t mean it should be destined for the landfill.
Our Boardman facility produces around 160 million pounds of cheese each year. 1% goes to waste — primarily due to quality or damage issues. Though that’s one of the lowest percentages in the industry, it’s still a mountain of cheese.
955K+ LBS
of cheese scraps diverted from our Boardman facility in 2022, increasing our diversion rate from 15% to over 60% at the site. In turn, this also reduced our landfill-based emissions by 36% in Boardman.

In June, we started diverting all of our loose and packaged cheese scrap at our Boardman facility to a food waste processor that uses the cheese for animal feed and compost.
A Solution for Food Scraps at The Creamery
A Solution for Food Scraps at The Creamery
Part of The Creamery visitors center experience is getting to enjoy a double scoop of creamy ice cream in a waffle cone. But with over one million visitors every year, that adds up to a lot of food prep waste.
Throughout 2022, The Creamery visitors center diverted all its prep kitchen food scraps to a local hog farm where it was mixed and used as hog feed.
According to the EPA, using food scraps as animal feed is the second-best use of food waste (behind feeding people), a fantastic solution for waste that was previously destined for the landfill.
~5,000+ LBS of food scraps diverted from landfill for animal feed in 2022. That’s enough to feed a pig for 100 days.

Inspiration from Overseas
Inspiration from Overseas
In 2022, the Goal Zero Team was invited by the Sustainable Industry Alliance (SIA) — an initiative through the Trade Council of Denmark — on an all-expenses-paid tour of several dairies and facilities across their country. The SIA team also visited Oregon to audit our manufacturing facilities in Tillamook and Boardman, where they identified best practices and innovations that can be applied to our operations here at TCCA.

FUELING OUR TRUCK FLEET FOR THE FUTURE
Once we make all that delicious dairy, we have to get it into the hands of our customers. For customers in the Pacific Northwest, we rely on our fleet of 16 trucks, which drive many miles through old-growth, evergreen forests, rolling high desert plains, small towns and big cities across the region. As we serve our neighbors, it’s important to deliver quality products without leaving behind emissions in our wake.
In 2022, our Logistics and Stewardship Teams began pursuing a new fuel called renewable diesel (R99). As a result, it will reduce fuel emissions from our fleet by 66%. Our truck fleet transitioned to this cleaner-burning R99 fuel at the end of summer 2022, and it has already had a notable impact in reducing our overall fleet emissions.
~66%
fewer Emissions
per mile by converting our truck fleet to R99.
More from our 2022 Stewardship Report
Footnotes
- Analysis conducted on participating TCCA farms provides carbon stock estimate for 30cm soil depth. The sample design parameters for the study were a confidence level of 70% and a margin of error of 10% for 84% of the total acreage sampled. The remaining 16% of the acreage sampled had sample design parameters of 90% confidence with 10% margin of error.
- Continental U.S. and Mexico data values are for the soil depth of 0-30 cm. Graphical data presentation and data range values provided by Oak Ridge National Laboratory — Distributed Active Archive Center (Comparative Soil Organic Carbon for Mexico and USA | ORNL DAAC News).


